This has been an interesting year in Seattle Real Estate. And it’s sure to continue in the year to come. As we approach the end of the 2nd Quarter of 2009 we can get perspective on how the year is shaping up.
The charts below are a good visual representation of activity in the Seattle Metropolitan area.
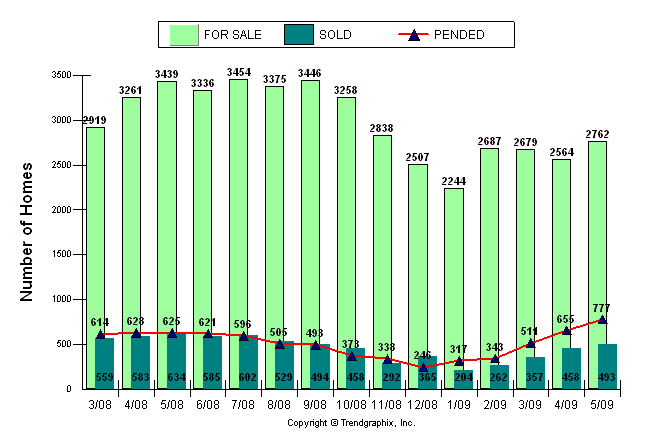
This chart represents active listings (light green), listings in contract with a buyer (Pended, red line) and closed transactions (blue).
We have seen a steady increase in sales closed and pending sales this spring with a relatively stable inventory base.

This chart shows average days on market for listings and overlays the list/sales price ratio over the top.
The rise in the number of short sales& bank owned listings has increased days on market significantly this year. You can see how that in turn affects the list price/sales price ratio. People pay less for homes that are on the market longer.

This last chart illustrates the months of inventory on the market.
We saw a startling five year peak of 11 months of inventory in January of this year and have seen a steady and dramatic decrease since then.
The trend so far this spring has been positive and we are hoping to continue to see improvement in activity and stability over the next half of the year. It is always our intention to provide sound information whether it’s good news or bad and we welcome your feedback! As always please don’t hesitate to give us a call if you’d like to discuss the Seattle real estate market in more detail.
Have a great week!
Sincerely,
Domenica
Windermere Real Estate


